Sunday 21 March 2010

GISTEMP attacked again

In recent days the accusation has been raised on "skeptic" blogs that GISTEMP has adjusted out the true extent of cooling from 1940-1978.

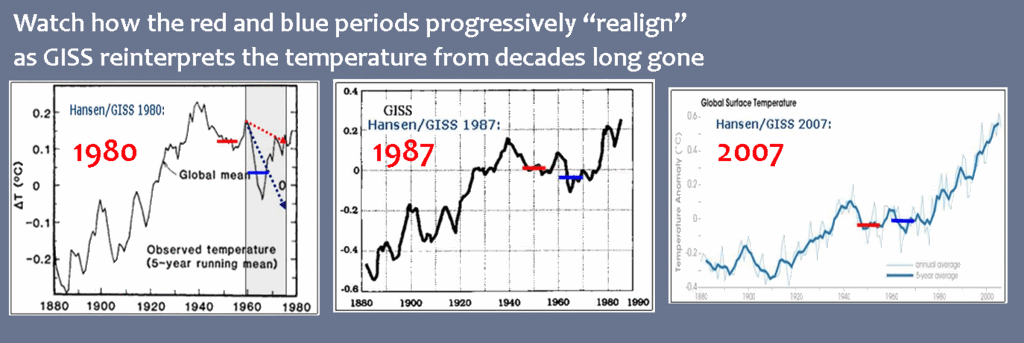
The accusers cite the image in the 1976 national geographic, which shows a large decline in temperature from the 1940s to the 1970s. The claim is that GISTEMP has erased much of the cooling seen in this 1976 national geographic imagine and even that Hansen has reduced the cooling over various versions of GISTEMP's history.

Below is the comparison image used which shows the red and blue lines drawn haphazardly on the images to convey a change in the data:


This is the original article
http://hidethedecline.eu/pages/posts/decline-temperature-decline-1940-78-the-cold-data-war-170.php

The accusations have then spread all over the skeptic blogs:
http://joannenova.com.au/2010/03/the-mystery-deepens-where-did-that-decline-go/

http://wattsupwiththat.com/2010/03/18/weather-balloon-data-backs-up-missing-decline-found-in-old-magazine/

And to less well known places:
http://wallstreetpit.com/20710-climategate-goes-back-to-1980

As usual though it's not the analyzers who make the strongest accusations, it's the blogs down the line who link to each other and heap on more and more libelous smears as they go. I even had one commenter on the Joannenova blog direct me here: http://hennessysview.com/2008/07/23/dr-james-hansen-of-giss-is-a-liar-and-a-fraud/. Through that descent into madness I may be getting close to the hideouts of the folks that send death threats to scientists.

GISTEMP 1980


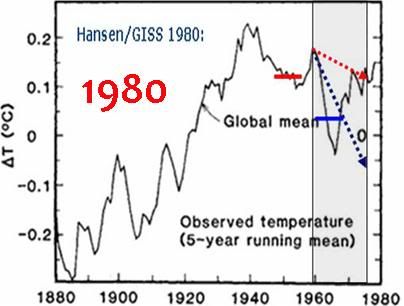
The underlying graph is derived from Hansen et al 1981 (PDF) although the hidethedecline.eu references the image in this NASA article. The paper doesn't really discuss the graph data much, I guess this is proto-GISTEMP. But the paper does strongly suggest that the graph is of meteorological stations. Ie no sea surface temperature input.

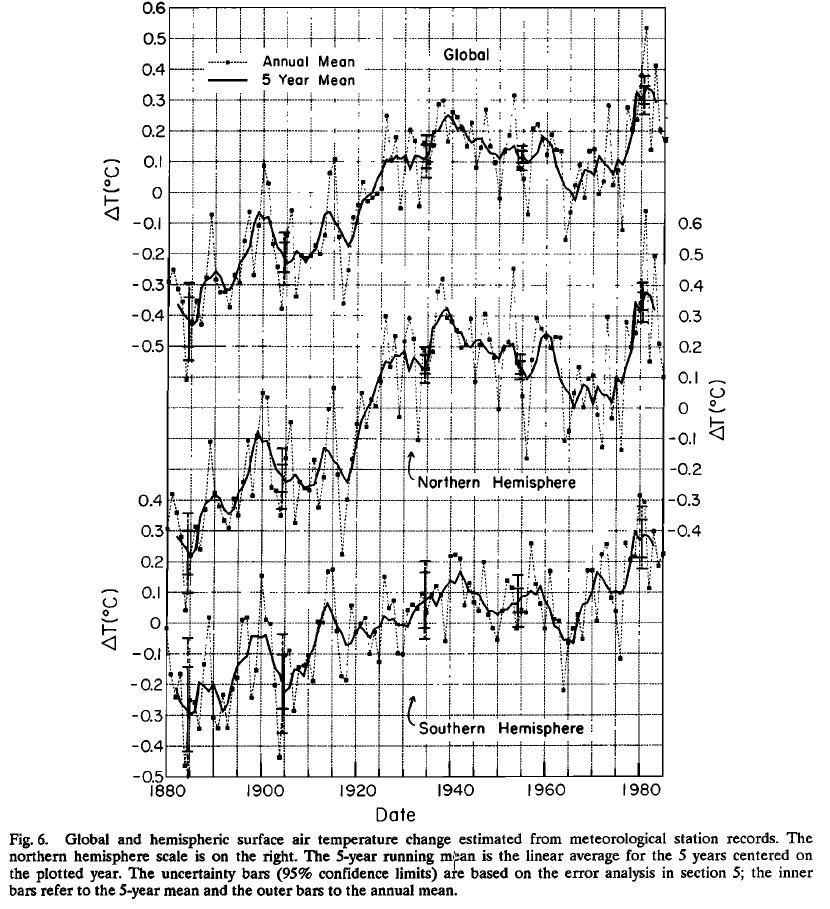
Hansen et al 1981 also shows the data for different latitude bands:


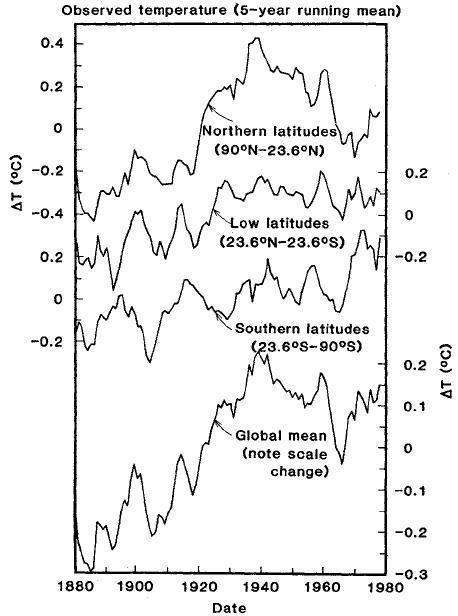
Suffice to say it's clear that the Northern latitudes exhibit a larger 1940s-1970s decline than the global record.

Hansen/GISS 1987


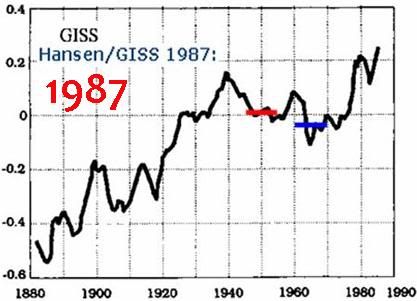
Not referenced. Hansen et al 1987 perhaps? The graphs in there don't quite match this one. Here are the graphs from Hansen et al 1987. These are for meteorological stations only:


Comparisons with modern GISTEMP

There is of course a difference between global GISTEMP using land from meteorological stations only, and global GISTEMP using meteorological stations plus sea surface temperature.


It is necessary to compare the old GISTEMP graphs with the right modern type. In this case the one using meteorological stations only.

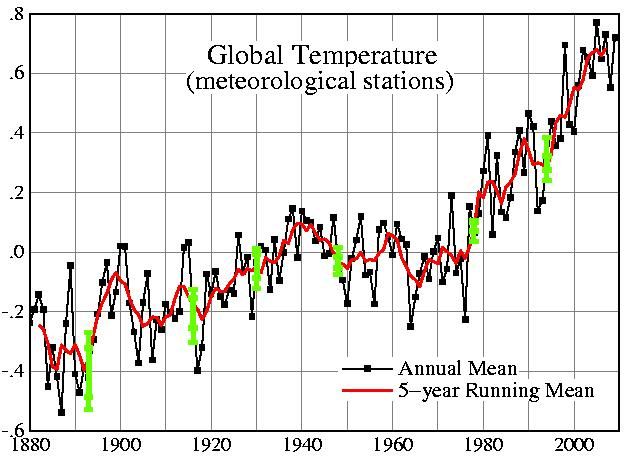
Comparison of Hansen et al 1987 graph (blue overlay) with current global GISTEMP based on meteorological stations:


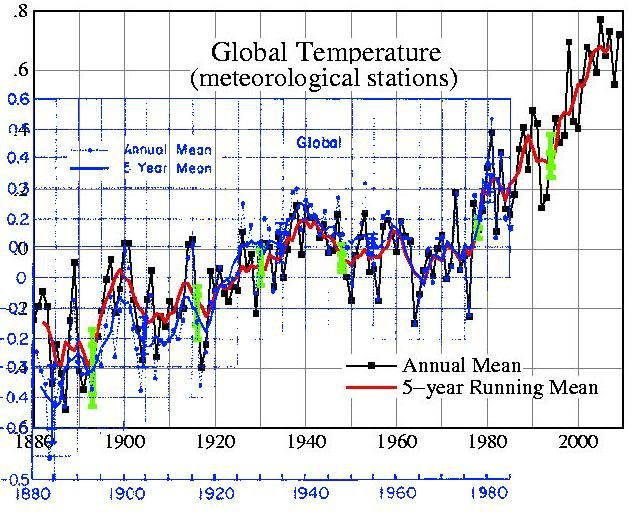
Comparison of Hansen et al 1981 graph (blue overlay) with current global GISTEMP based on meteorological stations:


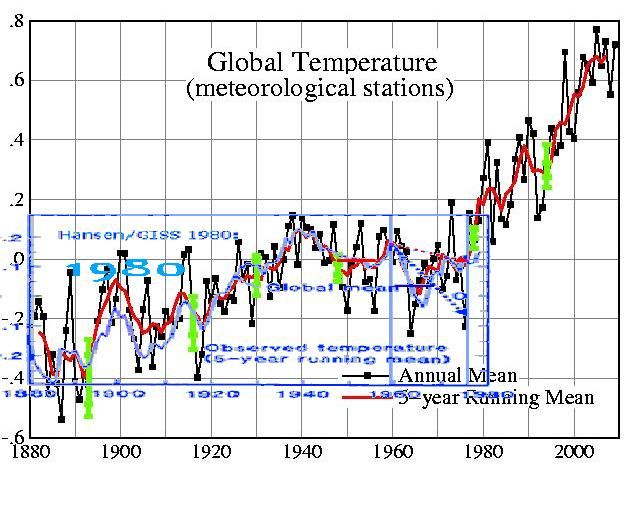
This overlay stuff is all rough eyeball stuff, but there is little difference here o get worked up about. GISTEMP does not show any change in the period 1940-1970 over it's history that deviate from what can be expected from changes in the algorithm, input data, etc. It even coincidentally seems to be within the error bars anyway. Much fuss about nothing.

On the last image notice that the modern GISTEMP image shows a large rise starting just before 1980 while the 1981 image shows (up to 1979) flat. decline.eu says:

"not only did Hansen alter the trend 1940-75, he also made a HUGE adjustment around 1975-80, much more warming trend in 2007 compared to 1981."

This is incredibly unlikely. Just how could one scientist engineer in a HUGE adjustment like that without anyone else noticing? Let alone getting it to stick. How would he even do it? He cannot alter the underlying met station data afterall. Can you not think of better reasons for the difference? I notice for example that the 1980 graph is plotted with a 5 year running mean, so potentially that is the problem as the end points of the Hansen 1981 graph will be affected.

The 1976 National Geographic graph

This is where the real disagreement is. GISTEMP and HadCRUT disagree with the following National Geographic graph:


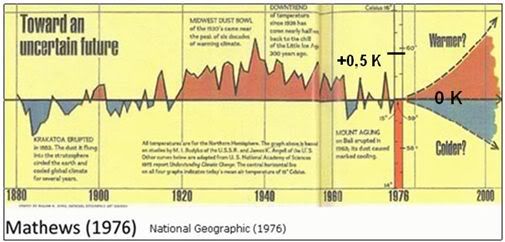
This graph uses data from Budyko 1969 (PDF) up to 1960. The final part past 1960 is produced from radiosonde data. It's the final bit involving the radiosonde data where the substantial disagreement with GISTEMP and CRU is (and raw GHCN...). While there is some disagreement between the Budyko data and the GISTEMP and HadCRUT data, I think that could be explained by the following.

The Budyko data is described in detail in Rockboc 1982 (PDF). The summary reads:

A Russian group under the initial leadership of M. I. Budyko, has produced the first analysis of monthly average surface temperatures for the North-ern Hemisphere on a 5x10 latitude-longitude grid. This data set and the magnetic tape of the data are described in this report. The Russian data set is the first and only available digitized, gridded collection of monthly average Northern Hemisphere surface temperature data. The quality of the data over land, especially for recent periods, should be excellent and useful for many studies of climate. The quality of the data over oceans is questionable, and, unfortunately, it will not be possible to objectively determine the quality by a reanalysis. I would recommend to some-one interested in data over the oceans, to either acquire data based on ship measurements (e.g., Pal-tridge and Woodruff, 1981) or wait for the analyses of the Climate Research Unit or GISS. These later analyses will be able to include an analysis of the quality of the data over the oceans, and the depen-dance of the results on the analysis technique used. I expect the analyses of the Russians over land to be very similar to those of these other two groups.

Note the concern about the ocean part of the analysis and the suggestion that GISTEMP and HadCRUT may provide more accuracy here. The paper also notes that
"few data were available for this period south of 20N and near the North Pole, so it was not really a hemispheric average."

Jones 1986 (PDF) mentions regarding the same Russian data:
"The Russians extrapolate their analyses over the ocean areas of the Northern Hemisphere, even though only isolated island data are available. This procedure is dubious and gives a false impression of the true data coverage."

That's plenty of reasons to think that the later analyses by CRU and GISS might find different results. I think it's important to look at papers published in the 70s and early 80s to figure out exactly when and why the changes occurred as scientists typically discuss differences between their results and the results of others. I was looking for Jones 1982 earlier which apparently reviews earlier Northern Hemisphere temperature analyses, but couldn't find a PDF.

To give a case in point as to why the above issues might affect the results, take HadCRUT and CRUTEM. Hidethedecline.eu has a post dedicated to the National geographic graph in which they compare HadCRUT3 Northern hemisphere with the national geographic graph.
http://hidethedecline.eu/pages/posts/temperature-corrections-of-the-northern-hemisphere-144.php

But if you use CRUTEM instead (land only), there is little disagreement through the Budyko data 1940-1960 (this overlay is y-aligned arbitrarily)
So inclusion of ocean data would seem to make a big difference. If Budyko is strongly reliant on land data then this could explain the difference.

As mentioned earlier the national geographic graph uses radiosonde data after the Budyko data ends. That's where there the big difference is. I haven't looked into this yet. I was hoping to find Jones 1982 and possibly some earlier papers which may shine light on the subject.

The bottom line for me is - why drag GISTEMP and HadCRUT into this at all?

The raw station data is out there and available. If skeptics think the 1970s show more cooling than GISTEMP and HadCRUT show, then by all means demonstrate this using the raw station data.

Tamino has already looked at the raw station data and the result has been reproduced by others too.


http://tamino.wordpress.com/2010/03/05/global-update/

The 1940-1970 decline in the raw station data is not as pronounced as the national geographic article. It's absurd on the face of it to accuse GISTEMP and CRU of hiding a decline which doesn't show up in the underlying station data they use.

Thursday 11 March 2010

Cryosat 2 - "Liftoff probably won't occur before early April"

Looks like they are busy fixing problems. It was previously scheduled to launch on the 25th February.

"CryoSat 2 is first in the queue, but liftoff of the ice observation craft from Baikonur probably won't occur this month due to the late discovery of a performance issue with the Dnepr's second stage steering system."

http://www.spaceflightnow.com/news/n1003/10dnepr/

Sunday 7 March 2010

SMHI and Phil Jones

Stockholm Initiative Called Out Over False Accusations Against Phil Jones

Stockholm Initiative delivers false statement about parliament enquiry

http://climateaudit.org/2010/03/05/phil-jones-called-out-by-swedes-on-data-availability/

The false statement is not made by the SHMI, but a body calling itself the "Stockholm Initiative". This is important to note, because the way it has been presented on certain blogs has mislead some people into thinking the false statement, with it's rather colorful phrasing, was made by the SHMI itself or another neutral Swedish science organization.

The press release containing the false statement actually comes from a body calling itself the "Stockholm Initiative" (Take a look at their website). Comparisons could be made with the Heartland Institute, although the Stockholm Initiative seems slightly more credible.

The opening words of the Stockholm Initiative press release contains a false statement attributing a statement to Phil Jones that he did not make. It wasn't Phil Jones who mentioned the data availability issue with the SHMI, it was the Professor Acton who was present alongside Phil Jones the parliamentary hearing (see the transcript of the hearing - http://www.publications.parliament.uk/pa/cm200910/cmselect/cmsctech/uc387-i/uc38702.htm). This is a very strange and disturbing kind of error given that the transcript is very clear on who said what.

This is not the only error however. The following blog post outlines "many factual errors" that are contained in the SHMI press release:
Climate sceptics are wrong about Phil Jones and SMHI

This press-release have gained considerable attention on climate denier blogs but contains many factual errors. To begin with swedish data is not in the public domain. SMHI have recently made some data available on the internet for non commercial use, but under the explicit condition that the recipient is not allowed to disclose the data.

The license agreement is very easy to find, and if you are able to read swedish the license agreement can be read here. Paragraphs §3.2 and 4.1 are the relevant ones and here's a rough translation of §4.1
4.1 The Licensee does not own the right på disclose, send on, link to or in any other way spread the contents of the data and/or products that has been recieved in accordance with this agreement to a third part.
This is not public domain.

But it is however standard policy for SMHI, and for most of the european wheather organisations. There are even some sort of common guidelines for this sort of thing. The SMHI and others are allowing scientists free access to their data, but they are not allowed to re-publish the data.


See also http://scienceblogs.com/stoat/2010/03/weird_stuff_from_the_swedes.php)

The Stockholm Initiative have not commented and clarified a response to their errors or explained how they came about. I only hope they step forward to clear matters up, or else I fear the world will not trust anything they say again. This is of course a very important subject and it would be a shame to see the reputation of such fine organizations as the Stockholm Initiative tarnished..

Saturday 6 March 2010

Test Cases

Any method to solve the problems of duplicate combination and homogenization of stations has to deal with any number of odd situations (3-way overlaps, gaps in records, spurious jumps, false trends, poor spacial coverage). I think I will approach GHCN analysis by producing a number of test cases which a method can be run against. The benefit of test data is you can know the ideal result and therefore can quantify the accuracy of the method in it's attempt to reproduce that result.

I got the idea from here:
http://treesfortheforest.wordpress.com/2010/02/10/methods-to-combine-station-data/

For example to produce a test case for the problem of duplicate merging, start off with an auto-generated ideal temperature record, clone it N times and damage those N clones in various ways (gaps, spurious trends, step changes, etc). Any method for duplicate-merging could then be tested against these N duplicate records to see how well it can reproduce the ideal temperature record. This can also be done for homogenization and other problems.

It would be nice to have a whole load of such test cases that can be run against different methods, both to verify that they don't make gross errors in certain cases, and to compare how well they do with other methods.

Below is a simple example of how a test case helped me spot a problem with my method for calculating the temperature trend of a record. Sorry to say I had assumed the slope of line of best fit through monthly data represented the temperature trend of that data.

For the test case I created a 100 year long test record spanning from January 1900 to December 2000. I intentionally designed the record so it would have an annual cycle but no longterm warming or cooling trend. So the data itself is just a sine wave around 10 degrees C. Any method that determines warming trends should find no warming trend in this record. Here is the first 5 years of the test data:


When I applied my slope of line of best fit method to this data, I found a warming trend of -0.002C/decade, or -0.02C over the entire 100 years.

I was surprised and thought I had an error in my linear trend calculation, I fully expected a full sine wave cycle to have zero trend. Glad I didn't trust my intuition. I checked against a few online linear regression applets and got the same result, so the calculation is fine. I now realize I could have figured this out faster using the the woodfortrees plotter.

If the annual cycle is 0C to 20C, instead of 9C to 11C, the cooling over the period is 0.2C! Even worse with just 50 years of data I get 0.075C/decade cooling. Overall that adds up to 0.375C cooling over the entire period. But of course there has been no such cooling in this test record, so the idea that sticking a line of best fit slope through monthly data will show the warming trend is false.

Many other people will already know this. Chad warned me about it in a previous post:
"One minor nitpick- I think you should convert to anomalies for the trend analysis. There might be some end point effects because of the annual cycle. It's probably nothing to be worried about because the data spans such a large period."

I do notice a bodge, like if I take an 18 month period from the sine wave starting at a certain point, the trend is flat. But I don't understand all this so it's a better idea to abandon the idea altogether.

What I know will work is to compute the annual average for each year and derive the trend for that. In the test data that will give the correct 0C slope (also works here)

So moral of the story for me is - test cases are important! And also I will have to work on producing and graphing annual data after.

Friday 5 March 2010

UAH switches to v5.3

http://www.drroyspencer.com/2010/03/february-2010-uah-global-temperature-update-version-5-3-unveiled/

Oh man does this mean icecap.us is going to have to redo all their graphs?

For all those easily locatable "skeptics" who insisted that past recorded temperature should not be changed, adjustments should not be made, etc etc - their shields are down, go get em.

Wednesday 3 March 2010

Stations reporting in the past ~month

I downloaded the latest GHCN raw mean data file to find that:

1306 Stations have reported January


328 Stations have reported February data already


1581 Stations have reported at least one month since February 2009:

Tuesday 2 March 2010

Contradictions

I was meaning to make this list for a while.


-Those darned climate scientists have deliberately fudged the surface temperature records so that they support manmade global warming!
-The early 20th century warming in the surface records disproves manmade global warming!


-Computers can be made to say anything! Those darned climate scientists have written the climate models so that the output supports manmade global warming!
-The climate models disprove manmade global warming because the output shows a hotspot that doesn't exist!


-The early 20th century warming in the surface records disproves manmade global warming!
-We can't believe the surface records. They are far too inaccurate!


-The ice core co2 records show co2 lags temperature, not the otherway round!
-The ice core co2 records are inaccurate due to co2 diffusing through the ice so we can't believe them!


-Low Climate Sensitivity!
-The Climate has changed a lot in the past!


-Mankind's resourcefulness and ingenuity will allow us to easily adapt to any change in climate or sea level
-A carbon tax will have a catastrophic effect on our economy and civilization

GHCN work continues...

The slow progress of GHCN analysis continues, nothing to show just tidying up some code. Have generated records for all stations using the simple duplicate merge method, but haven't done anything with them yet. Instead I decided to put in place the ability to add new duplicate merging methods without losing the older methods and associated data. That should make it easier to compare different methods later. Nothing to show from doing this kind of stuff, but it should make work faster in the longrun. I am generally slower than most people, I notice quite a few people seem to have produce GHCN raw results in a couple of days. A number of people have already reproduced Tamino's result (http://tamino.wordpress.com/2010/03/01/replication-not-repetition/) and I am going to be too late that that party anyway :( all the drinks will have gone. Nevermind, it is good because now if my results don't match everyone elses I will know I've almost definitely done something wrong.