Sunday 31 January 2010

GHCN Graphs

Today I have added the ability to graph the data. I could have exported the data in a format that something like Excel could have plotted, but I didn't want that kind of frustration. So I've added some graph plotting code to the GHCN processing code that basically writes bitmaps to screen. It was a lot of flaffing about and trial and error with drawing lines and strings to a bitmap. That's why there's some things missing like axis labels and a legend.

Below is the plotted GHCN raw temperature data for Darwin, Australia during the period 1940-1970. I used the following query. Darwin has 5 duplicate raw records.


Station darwin = (from s in ghcn.Stations
where s.Name.Contains("darwin") select s).First();
Graph g = new Graph();
g.AddPlot(darwin.RawRecords[0], Color.Red);
g.AddPlot(darwin.RawRecords[1], Color.Blue);
g.AddPlot(darwin.RawRecords[2], Color.Green);
g.AddPlot(darwin.RawRecords[3], Color.Orange);
g.AddPlot(darwin.RawRecords[4], Color.Purple);
g.Render();


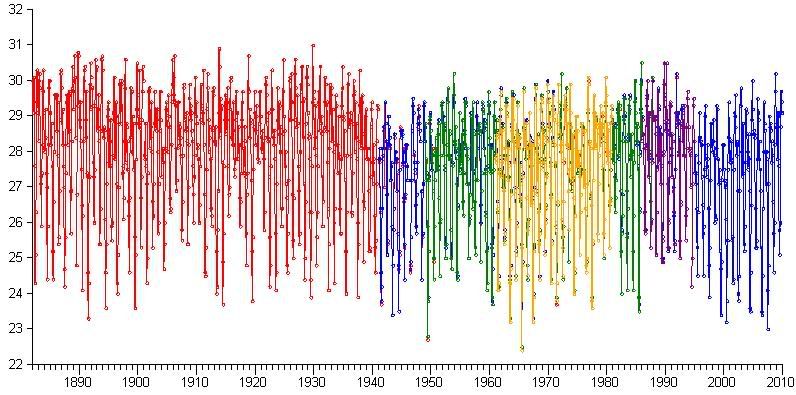
You can see that the duplicates are very similar, but obviously different enough that they were left as duplicates in the GHCN database. There are some missing values. Here is the full span of the raw data. One of the duplicates goes right up to 2010:


These plots are of monthly means. There are issues with generating annual means due to missing months that I don't really want to think about at the moment. I won't bother plotting annual means yet, I don't see the point. For calculating, say a linear trend, it will be safer for me just to stick to the monthly data.

Next I will add the ability to query the linear trend for a particular record over a specified period of time. It will then be possible to produce a list of stations ordered by temperature trend over an arbitrary period. I also want to be able to query for the extent of records, eg select only the station records that cover a certain period of time.

Saturday 30 January 2010

GHCN World Map

Today I wrote a C# program to preprocess and load GHCN data into a number of classes.

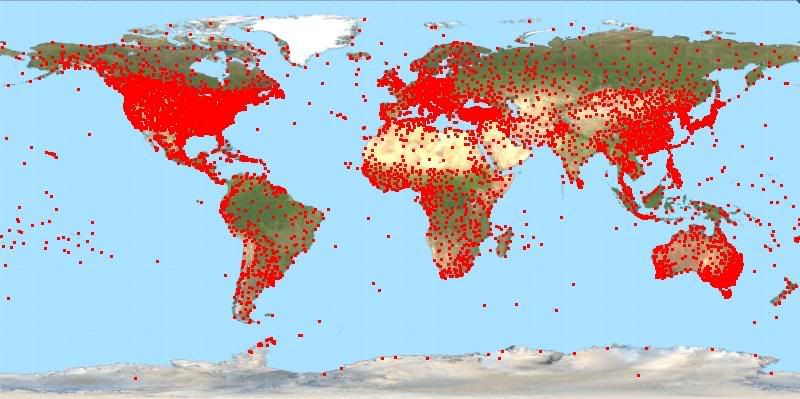
I have written a Worldmap class which can be used to plot a list of selected stations. For example the above image is generated with this line of code

map.Plot(ghcn.Stations, Brushes.Red);

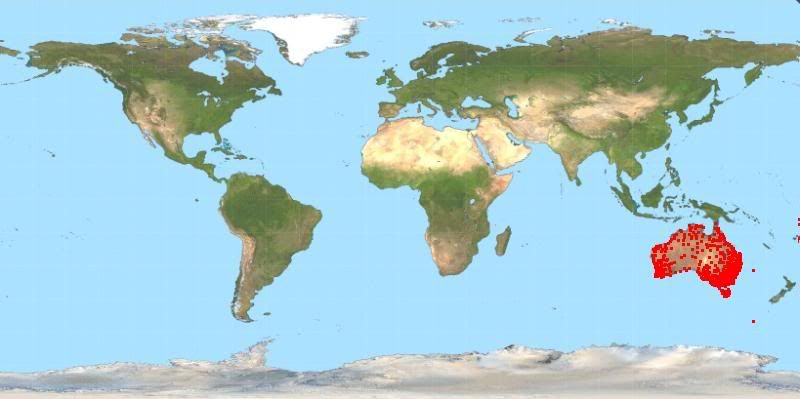
Using C# and LINQ it's easy to produce all number of queries to select subsets of GHCN stations. For example the following query selects all stations in Australia:

map.Plot( (from s in ghcn.Stations where
s.Country == "AUSTRALIA" select s).ToList(), Brushes.Red );


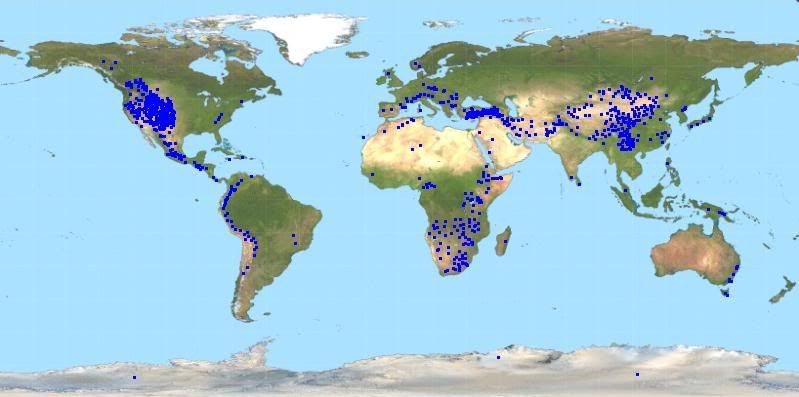
Or to select all stations above 1000m elevation:


map.Plot( (from s in ghcn.Stations where
s.Elevation > 1000 select s).ToList(), Brushes.Blue );


Here's a particularly crazy query. All stations below 100 meter elevation above 60N or below 60S whose station name begins with 'A'. I won't bother graphing it, there are only 16 stations that match this very specific query.


(from s in ghcn.Stations where Math.Abs(s.Latitude) > 60 &&
s.Elevation < 100 && s.Name.StartsWith("A") select s)


The great thing about LINQ is by adding more properties to the Station class they will be automatically available to query. Once I integrate the station temperature data into the Station class, it will be possible to query based on the data, such as querying for all stations with a temperature record that has a trend greater than a specified amount or querying for all stations with records that cover the period 1920-1960 or combinations of the lot. Using LINQ it's also possible to order the result set, eg ordering by elevation or ordering by length of temperature record, or trend.

For now I am working on loading the raw and adjusted temperature data. As a preprocessing step I have split the v2.mean and v2.mean_adj files out so that each station has it's own file containing it's temperature records. This way individual station temperature data can be loaded from disk as needed, rather than loading the whole lot up front, which takes time and a whole lot of memory.

Once the temperature data can be loaded and queried I need to write a load of utility methods, such as one to calculate the distance between two stations and a load of trend calculating ones. I haven't figured out yet how to handle calculating the trends. I am not familiar with statistical analysis or how to combine multiple temperature records. Will have to just cross those bridges when I come to them.

I also need the ability to graph temperature records.

Tim Lambert's parody of psuedoskeptic faux outrage

Well it's more of a piss take than a parody.  

David Rose does seem to uncannily keep being tricked by those darned scientists into reporting things they later claim they never said and so if nothing else this subject does raise the real issue of why scientists keep being misrepresented in the media.

But the way Tim Lambert has handled it has to be a piss take of the denialosphere's tactic of whipping up a storm (as Hansen would say 'a tempest in a teapot')

The first post at Deltoid was titled Rosegate. Say no more!

http://scienceblogs.com/deltoid/2010/01/rosegate.php

It then became a self-described growing scandal, with a new post Rosegate Scandal Grows

http://scienceblogs.com/deltoid/2010/01/rosegate_scandal_grows.php

Then it becomes ever growing.

http://scienceblogs.com/deltoid/2010/01/rosegate_scandal_still_growing.php

And it just won't stop as David Rose is "caught" again.

Rosegate: David Rose caught misrepresenting another scientist

  • Use of the gate suffix. Check.
  • A self-proclaimed scandal. Check.
  • A scandal that just won't stop growing. Check.
  • New Developments, as in "two shock new developments". Check.

David Rose himself (or someone claiming to be him) turns up in the comments at one point. I guess someone tipped him off...Hilariously all he accomplishes by injecting his opinion is to have his words misrepresented for the next post on the subject.

The whole thing reminds me of tabloid style reporting along the lines of "There was public outrage last night when ...". Given that most of the public are reading about the issue for the first time over breakfast, the paper cannot possibly be reporting on a widespread "public" outrage "last night". Tabloids quite often just exaggerate relatively minor things into "public scandals" and whip up "outrage" for headlines. Much like the psuedoskepic blogs. Eg WUWT. They pretend they are just reporting a story, when in fact often they are the ones generating the story from something that is really quite trivial or not even news at all.

The Biggest Control Knob - Carbon Dioxide In Earth's Climate History

If you haven't seen Dr Richard Alley's AGU lecture, I recommend it. 

http://www.agu.org/meetings/fm09/lectures/lecture_videos/A23A.shtml

There is some good evidence presented that co2 is a big factor in climate across geological time, although the surrounding info about how co2 and temperature paleodata are gathered and how co2 and temperature have changed over geological time is interesting in itself.

And if you've ever wanted to see an audience of scientists laughing at a denialist's stupid accusations then this is the video for you.


Friday 29 January 2010

GHCN v2

GHCN v2 is a database that contains monthly mean temperature data for thousands of stations across the world. This data was gathered from existing databases and by requesting station data from various countries in the late 90s. Since then a subset of the data is updated each month - those countries or stations that support monthly reporting.

Two papers that describe how the data was compiled, what it is, etc can be downloaded here: http://www.ncdc.noaa.gov/oa/climate/ghcn-monthly/index.php

GHCN v2 data can be downloaded from here: ftp://ftp.ncdc.noaa.gov/pub/data/ghcn/v2/zipd/

Everything in this folder is ziped (even the readme). I'll skip some detail and mention some of the more interesting parts of these files.

readme.temperature describes the files and their format.

The file v2.mean contains raw mean monthly station data for all stations in GHCN v2. It has undergone quality assurance, but not homogenization. Each line in this file is a year of absolute monthly temperature data for a station. So for example here are three lines from the file:

1016035500001968 109 123 130 160 181 207 247 241 223 191 162 128
1016035500001969 117 114 134 149 182 194 223 241 220 185 161 108
1016035500001970 129 110 122 138 165 211 232 249 233-9999 148 114

I've bolded the year in each line. The 12 numbers after the year are the absolute mean temperature reading for each month of that year in tenths of a degree C (so divide by 10 to get the actual absolute mean). You can see that -9999 is used to denote a month with missing data. The 12 digits before the year essentially identify the station.

Here's is another line to demonstrate something:

1016035500011970 129 110 122 138 165 211 232 249 233 184 148 114

Note that this line shares the same first 11 digits, but the 12th digit (marked in red) differs from the three above. This is actually the same station. During the GHCN data gathering process more than one monthly mean temperature record was found for this station, and they were different enough that GHCN included both and marked them as duplicates. The 12th digit is a 'duplicate' code. In this case both record '0' and record '1' have identical values for the months in 1970, although record '1' is not missing the value for October.

The file v2.mean_adj is the same format, but it contains adjusted monthly mean temperature. Adjusted as in homogenized.

The file v2.country.codes is obviously named. Here's a line from the file

101 ALGERIA

That tells us the station we were looking at above is in Algeria. The first 3 digits of the station identifier are the country code.

The file v2.temperature.inv contains a list of all stations in GHCN v2 and information about those stations. Each line is info for a station. Here's an example from the file:

10160355000 SKIKDA 36.93 6.95 7 18U 107HIxxCO 1x-9WARM DECIDUOUS C

The first 11 digits are the station identifier. It's the station we were looking at earlier. It also has the name of the station location, Skikda, then it's Longitude and Latitude, elevation above sea level, and some other info about the station location.

I am first going to focus on the raw data file first. Tomorrow I will write a program to load the data.

I changed the template for the blog, the old template was ridiculous. Even with a wide monitor the blog text was constrained within a ridiculous width. I am amazed that any such template could exist - it's unreadable. The new template should allow the text to fit the width of the window. I also removed pointless clutter like the "followers" box and the "about me" box.


Thursday 28 January 2010

The Real Report

Last post I critiqued a preliminary report and I now find the Real Report is available:

http://scienceandpublicpolicy.org/images/stories/papers/originals/surface_temp.pdf

So lets abandon the preliminary report and focus on the real one. I will start again. Given the report is 111 pages long I don't expect to finish, but lets go with it anyway.

I'll note right away the acronym SPPI is all over this. We all know what that is or can google it, so lets not labor that point.

We start with a section titled "SUMMARY FOR POLICYMAKERS" which lists a load of their conclusions.

Are these guys so divorced from reality that they actually think policymakers would read (let alone take advice from) such a non-peer reviewed report which comprises of some observations by some bloggers? Perhaps not. Perhaps they just like playing Science, or rather making certain other people think they are doing science.

Lets start with their first stated conclusion. I will just note some immediate thoughts I have. I spot quite a few oddities in just one of their sentences. The rest of the report may clarify these issues. Or not. I suspect not. I am not confident that the report authors really thought how their own conclusions fit together.

"1. Instrumental temperature data for the pre-satellite era (1850-1980) have been so widely, systematically, and unidirectionally tampered with that it cannot be credibly asserted there has been any significant “global warming” in the 20th century."

Summary For The Rational: The above statement is bullshit

  1. I have been told by skeptics on many occasions that of course they accept the earth has warmed, they just question the cause. Calling them "Global Warming Deniers" drives them mad, because denying the warming must be some kind of stupid thing to do. Except in this report here and now we have skeptics claiming "it cannot be credibly asserted there has been any significant “global warming” in the 20th century."
  2. What happened to the denialist "recovery from the little ice age" meme? I guess that was just the excuse du jour until they could find a better one...and they sounded so sincere...
  3. I note boreholes, glacier decline, sea level rise, the oceans have warmed too, etc (oh even tree rings!). All of which make think it's highly unlikely that the Earth hasn't warmed significantly over the 20th century. 
  4. Oddly their conspiracy ends at the satellite era. That's a little suspicious for my liking. I wonder if they chose that date because they don't want to accuse their friends at UAH of fraud. Perhaps they'll justify such a strange cut off date in the rest of the report. Or perhaps not.
  5. How can they claim the tampering in the records is prior to the satellite record when they are known to be always harping on about Hansen tampering with recent years, etc? What about the whole Station Dropout allegations that EM Smith et al bang on about? The station dropouts were in the 90s and the psuedoskeptics bang on about it as if the removal of the stations to warmer areas creates biased warming. They also of course claim UHI isn't corrected for and microsite biases - Anthony Watt's has a whole load of photos of recently installed AC units (in the satellite era). So it's sheer bullshit for them to try and section off their conspiracy to before 1980. And I think they do this so they don't have to question the satellite record which shows roughly as much warming as the surface records since 1980.
  6. Even if their claims were true, and I hope to analyze the temperature record myself in regards to their claims, does any of this alter the fact that current scientific evidence shows the climate probably has high sensitivity and that doubling co2 is a very large forcing? Nope.

2. All terrestrial surface-temperature databases exhibit very serious problems that render them useless for determining accurate long-term temperature trends.

Yet on page 6 they say:

"Calculating the average temperatures this way would ensure that the mean global surface temperature for each month and year would show a false-positive temperature anomaly – a bogus warming. This method would also ensure that the trend in the temperature change would be enhanced beyond the natural 60-year climate cycles."

(emphasis mine). How can they claim 60 year cycles exist in temperature records which they claim are useless for determining accurate long-term temperature trends. Sure a cycle isn't a trend, but a 60 year cycle sure as hell is made up of the longterm trends they claim the records can't show. In other words I think the uncertainty they are trying to exaggerate precludes any knowledge about the existence of a 60 year cycle.

That's enough for now. More to come. I will hopefully also examine their technical claims in more detail with reference to GHCN, but it'll take me time to read the docs and process the data. For now read some work by others on this subject: 

http://moyhu.blogspot.com/2010/01/ghcn-stations-warming.html

http://www.yaleclimatemediaforum.org/2010/01/kusi-noaa-nasa/

http://moyhu.blogspot.com/2010/01/ghcn-station-selection.html#more


Wednesday 27 January 2010

Joseph D'Aleo and his Technically Flawed Report (Page 1)

Someone called Joseph D'Aleo has put his name to a particularly nonsense PDF titled Climategate: Leaked Emails Inspired Data Analyses Show Claimed Warming Greatly Exaggerated and NOAA not CRU is Ground Zero

I am going to critique it. It's a long PDF so I will do so one page per post. Feel free to add your own observations in the comments. If it's good I will insert them.

http://icecap.us/images/uploads/NOAAroleinclimategate.pdf

"This is a preliminary introduction – final much more complete report will be posted here and on SPPI, which has supported the study shortly"

Hopefully he's just going to add more bullshit and not modify the existing bullshit so that I can just expand my critique.

"The global data bases have serious problems that render them useless for determining accurate long term temperature trends. Especially since most of the issues produce a warm bias in the data."

This is of course what psuedo-skeptics the world over want to believe. They really hate the surface records. Why is that? Is it just a means to smear the scientists working on those records (ie Hansen is a famous "AGW leader" therefore lets smear Hansen by smearing his work...surface records)? Or are they just grasping at any angle they can make against AGW (eg attack the co2 record with Beck, attack the greenhouse effect with G&T, etc)?

"The Climategate whistleblower proved what those of us dealing with data for decades already knew."

Use of the term Whistleblower is yet another conclusion reached based on wishful thinking rather than facts.

"The IPCC and their supported scientists have worked to remove the pesky Medieval Warm Period, the Little Ice Age, and the period emailer Tom Wigley referred to as the “warm 1940s blip.” They have also worked to pump up the recent warm cycle that ended in 2001."

Is D'Aleo ignorant of the fact there are real scientific questions over the extent of the 1940s blip and the medieval warm period? If he is aware of such subtitles of science he doesn't mention them. Note also that the Little Ice Age, the Medieval Warm period and the 1940s blip still exist. They haven't been "removed"

The claim that scientists have pumped up the recent warm "cycle" defies the fact that the satellite records also show it. Unless of course he's also claiming the scientists working on the satellite records are committing fraud. But I doubt it, pseudo-skeptics only ever have the stomach to accuse surface record scientists of fraud. The satellite record is surprisingly free of smear and FOIA requests for raw data and source code, despite it's complexity.

Also take note of his silly claim of a warm cycle that ended in 2001.

"Programmer Ian “Harry” Harris, in the Harry_Read_Me.txt file, commented about"

He then quotes Harry having problems. Irrelevant. Might as well have posted a picture of a cat. We know that the hadcrut results are not some figment of the source code because GISTEMP and NOAA products similar results with different code. You'd only post extracts from Harry if you were simply trying to create a big childish fuss. You wouldn't waste time doing it if you had a serious point to make.

"There has clearly been some cyclical warming in recent decades most notably 1979 to 1998"

There's that off-hand remark that recent warming is "cyclical" again. Except now it's ended in 1998 instead of 2001. Go figure. Why not just point out the warming? Why say "cyclical warming"? I think we all know what he's trying to imply. But perhaps he forgot something he said right at the start of the page:

"The global data bases have serious problems that render them useless for determining accurate long term temperature trends"

Okay so strike out the "global data bases" (sic), what does Joesph D'Aleo have left to proclaim a cycle stretching back prior to 1979? Tea leaves?

The sorry state of psuedo-skeptics is they are so caught up throwing out silly claims left right and center that they don't notice the silly claims contradict.

"However the global surface station based data is seriously compromised by major station dropout. There has been a clear bias towards removing higher elevation, higher latitude and rural stations"

Joseph forgets that the "station dropout" occured since 1979, therefore clearly it hasn't "seriously compromised" the surface record at all or it would deviate significantly from the satellite record during "station dropout", yet it doesn't.

"The data suffers contamination by urbanization and other local factors such as land-use/land-cover changes, and improper siting. There is missing data and uncertainties in ocean temperatures. These factors all lead to overestimation of temperatures."

But are they corrected for Joseph? That's the question and again let me point you at the close agreement with the satellite records. Are you quibbling over 0.05C warming since 1979? If more than that then we have a situation where the lower troposphere would have warmed more than the surface. Care to explain that one? No probably you'll just pussy foot around ignoring it.

"Numerous peer-reviewed papers in the last several years have shown this overestimation is the order of 30 to 50% just from the contamination issues alone. The cherry picking of observing sites and the increase of interpolation to vacant data grids makes these estimates very conservative."

There are Numerous peer-reviewed papers, but they are just too numerous to mention in a PDF. We might run out of words! His claim that "makes these estimates very conservative", is smells of pure bullshit.

What's he claiming? That the surface has only warmed less than half as much as the records show since 1979? It certainly sounds like it unless he's claiming all the factors he mentioned above are dis-proportionally occuring prior to 1979. Again this idea doesn't make any sense as it would mean there had been a lot more warming in the lower troposphere than  happened at the surface. Does that make sense? Not to me. It kind of needs explaining, not ignoring.

"The data bases on which so many important decisions are to be made are “Non Gradus Anus Rodentum!”"

Data bases are bases full of data. You mean databases, one word. Might be a good idea to get that right before moving in on Viscountish Latin.

Oh and WTF you just quoted Ghandhi at the end of page 1. What a fucking joke.

So concludes page 1.


Tuesday 26 January 2010

Bullshit CO2-Temperature Graphs

You know the ones, lots of variants. They are from icecap.us I think. A whole batch of bullshit graphs comparing co2 to temperature in a denier friendly way. The one below has temperature since 1997 plotted against co2, with the co2 axis scaled up ridiculously large to make it look like a total mismatch. Here is one version of the bullshit co2-temperature graph on a psuedoskeptic blog:

http://globalsham.blogspot.com/2008/03/co2-vs-global-mean-temperature.html

The way it's scaled they imply an expectation of about 0.7C warming from a 5% increase in co2, or 0.7C warming per decade. Here's it scaled better (not perfect, but it's closer):

http://www.woodfortrees.org/plot/esrl-co2/from:1997/normalise/mean:12/detrend:0.5/plot/uah/from:1997/normalise

Maybe if the idioteam directed some of their witchhuntgate paranoia onto their own material they would have a lot more success at uncovering "fraud". Of course as Wade pointed out (I suspect this will become a "law of Wade"), they will probably claim they only do it because the "AGW crowd" do it.

First post

Another silly post on Watt's blog which doesn't so much miss the forest for the trees as notes the forest, ignores the forest and then goes looking for a tree. 

Post titled: "Sanity check: 2008 & 2009 Were The Coolest Years Since 1998 in the USA"

Starts by noting the forest if only to dismiss it. Obligatory GISS smear included:

While the press is hyperventilating over NASA GISS recent announcement of the “Hottest Decade Ever“, it pays to keep in mind what happened the last two years of the past decade

He's talking about the last 2 years of the US temperature record. That's pretty much the point of the post. That's right. He's hand-waved the far bigger and more relevant statistic - the entire globe over the past decade - in order to focus on some cooling he found in 2% of the Earth's surface in the past two years.

Furthermore the "pays to keep in mind" is made as if the last two years of temperature in the US record somehow overshadow the fact the last decade was the warmest on record. It doesn't. It was. GISS shows it. UAH shows it. They all show it. Get over it.

Question: If he wants to focus on the last 2 years of temperature data, why does he focus on the US and not say the Globe?

So we have dismissal of the bigger statistic - warmest decade on record, plus accusing those of citing it of "hyperventilating" and then fabricating a big deal out of a far more mundane statistic.

And then posting the Trenberth Travesty Email. What a fucking joke.

Your thoughts are welcome. Did I miss something?

Oh yes the comments of the article. You can't take the comments too seriously. We have the usual stupid from someone called 'Jim S', which I only include here just to remind everyone of the strangely unnotable background hum of stupidity in the comment section of WUWT.

Jim S:
The earth is cooling. The next decade will be much colder than normal. All funding should be withheld from NASA until there is a full explanation of this fraud.

Then Wade makes an admission.

Wade:
To Wouter: There is a reason why we like to start with 1998. It is the same tactic the AGW crowd uses of taking a very low temperature as a starting point and saying “see it is getting warmer!” So two can play that game. “See it is getting cooler!” If you condemn this, you must also condemn when the AGW crowd does it as well.

So they do it knowing it's wrong? Just because the "AGW crowd" do it? What tosspots!

I do however think Wade is talking out his ass in this case. My recollection over the past few years is that cherrypicking of start points is an almost exclusive tactic of pseudoskeptics. That they've convinced themselves that the "AGW crowd" do it as much as them probably speaks more of their delusions. You know these people cannot even keep track of basic facts. Eg:

Henry chance: 
Hide the decline. 
CO2 was at 400 ppm in 1942. It has also fallen since then.
400 ppm in a post on a warmist blog will be enough to get the post deleted.

That's what this blog is about. Citing them. Laughing at them. Find some more, post some more. Any psuedo-skeptic blog or site.